Supercharge worksite productivity with Sitemetric AI.
Learn more
Workforce data from hundreds of active jobsites shows where safety risk builds up on data center projects, and how safety teams can see it sooner.
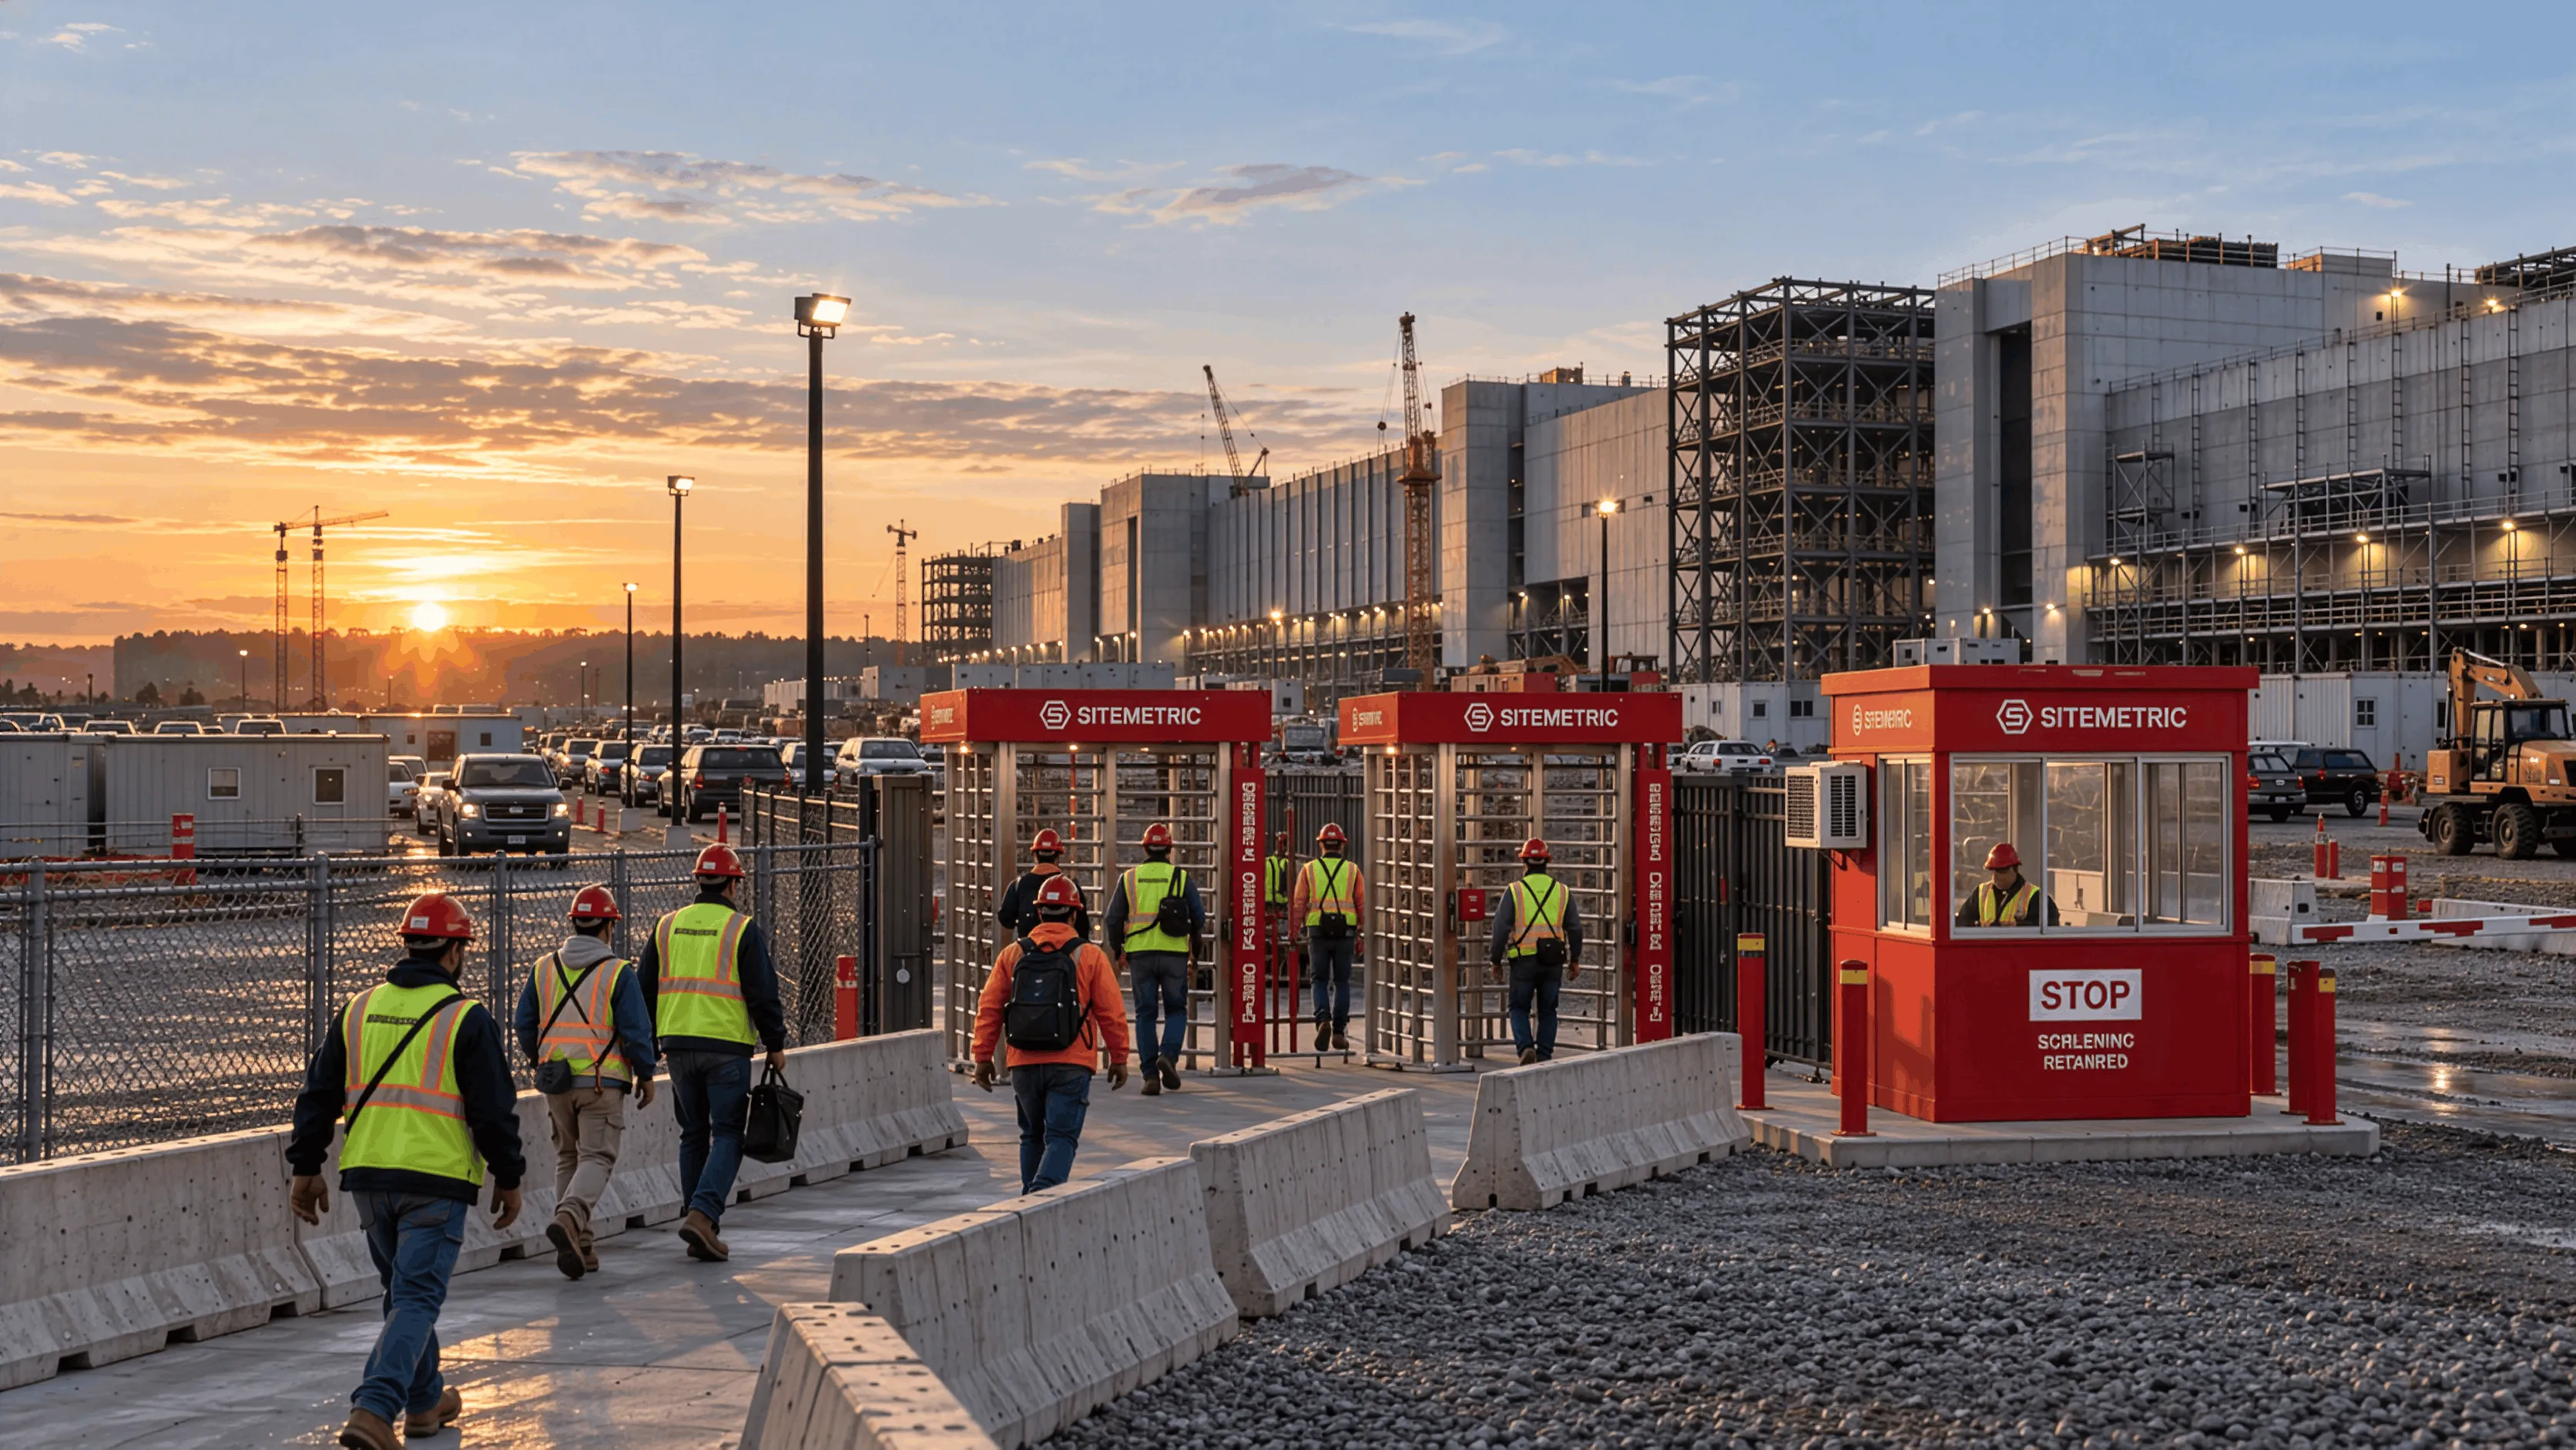
Data center construction safety risk tends to gather in a few predictable places: new workers, crews logging long hours, the early-morning gate rush, and lighter crews on weekends and at night. Sitemetric detects people at the gate and, with sensors, by building, floor and zone on hundreds of active projects, most of them data centers. In September 2026 alone, that came to about 4.5 million worker-days.

Workforce data works as a leading indicator for data center construction safety. Much of the risk on these jobs shows up in the data first: new people, long hours, the 5 a.m. crush, lighter weekend crews and who is in restricted areas. When a safety team can see those patterns, it can act on them sooner.
Workforce data is a leading indicator. Most of the risk on these jobs shows up in the data first.
Flags only help when they point to the right things. Too many alerts and teams start to tune them out, a problem Sitemetric has written about in Construction Site Security Has an Alert Fatigue Problem.
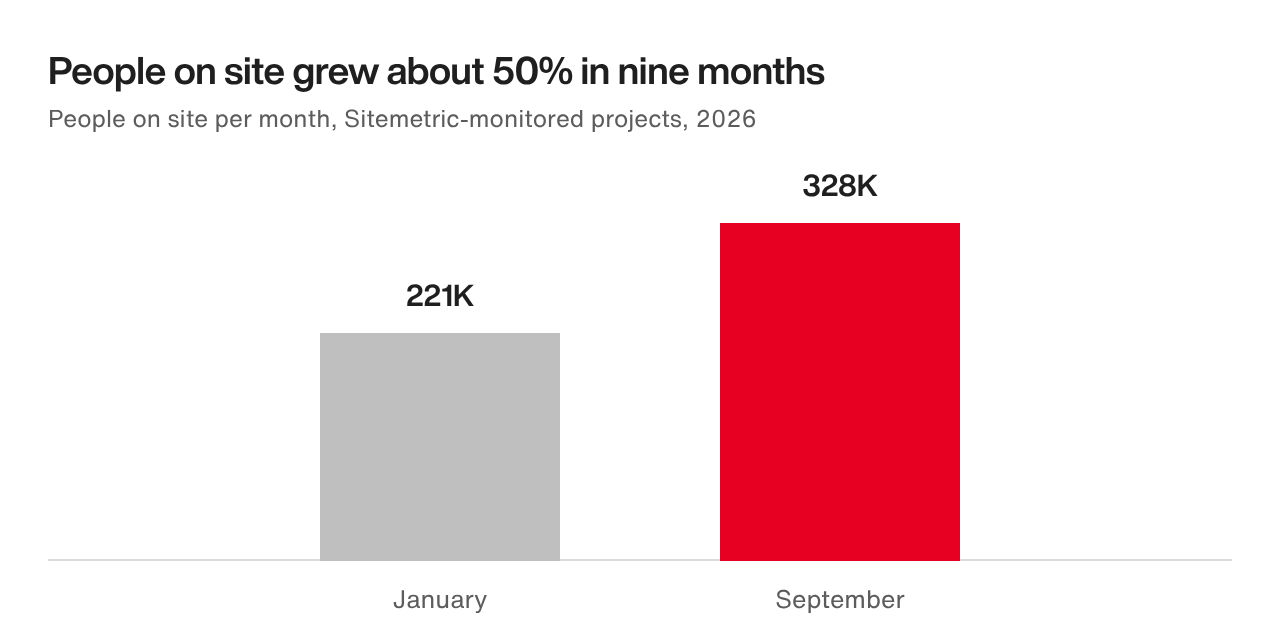
The number of people on Sitemetric-monitored jobsites rose from about 221,000 in January to 328,000 in September, and the jobs themselves are getting bigger. Every trend below grows out of that scale. For more on running a workforce that size, see Sitemetric's guide to construction workforce management. For how Sitemetric supports these projects, see Sitemetric for data center construction.
Every month from January to September 2026, about 1 in 5 worker-days belonged to someone in their first 30 days on that site. On a 1,000-person job, that is around 200 people still getting to know the gates, the muster points, the traffic routes and the site rules. Read more about new worker safety in construction.
About 6% of worker-days in September ran past 12 hours on site, around 266,000 long days. Just 5% of crews accounted for 86% of them, which turns fatigue into a short list of crews to focus on. Read more about construction fatigue management.
At the busiest site Sitemetric saw, 1,089 workers came through the gates in 20 minutes on August 26, nearly one person every second. That puts pedestrians, vehicles, gate lines and pre-task planning into the same short window. Read more about construction site traffic management at shift start.
About 1 in 10 worker-days falls on a weekend, plus whatever is happening at night. Those shifts often mean smaller crews, different supervisors, commissioning and tie-in activity, and fewer eyes on site. That is when routines can slip, and when a little extra visibility helps most.
Two questions are worth asking before every weekend:
Sitemetric's Daily Report and Headcount & Hours show who was on site over the weekend and at night, by company, by count and by building or zone, ready for Monday morning. Teams can also ask Sitemetric AI a question like "Who was on site Saturday night?"
Jobs keep getting bigger. Gallagher Bassett reports that U.S. data center construction starts hit a record $25.2 billion in January 2026, with average project value up 70% to $633 million. It points to commissioning and energization as high-risk stretches, and to big crews on tight schedules raising struck-by, access and fatigue risks. (Gallagher Bassett, September 2026) Knowing who is inside an energized area during commissioning is where zone detection pays off.
Heat is also still on the enforcement agenda. OSHA has not finalized its proposed heat rule, but in April 2026 it renewed its heat National Emphasis Program for five more years, and construction is covered. OSHA can also cite heat hazards under the General Duty Clause, so water, rest, shade and acclimatization plans stay important on projects nationwide. (Littler, April 2026; OSHA Directive CPL 03-00-024)
Sitemetric's construction safety platform already captures who is on site and where. Here is the paperwork it handles, and the time it gives a site safety manager back.
Added up, that is roughly a full day a week back for a site safety manager on a large job.
Unless noted, figures come from badge data at sites Sitemetric monitors, January to September 2026, mostly data center projects. Hours mean time on site between badge-in and badge-out, not hours worked. A crew is one company at one site; weekly figures are for September 14 to 20. Gate-timing figures are the average weekday from September 21 to October 18, 2026, using each worker's first and last scan of the day. Twenty-minute records are each site's busiest day from July 1 to October 20, 2026. All figures are combined across sites.

Talk with our team about your jobsite needs and learn how Sitemetric can help your project succeed.